Meilleurs Agents
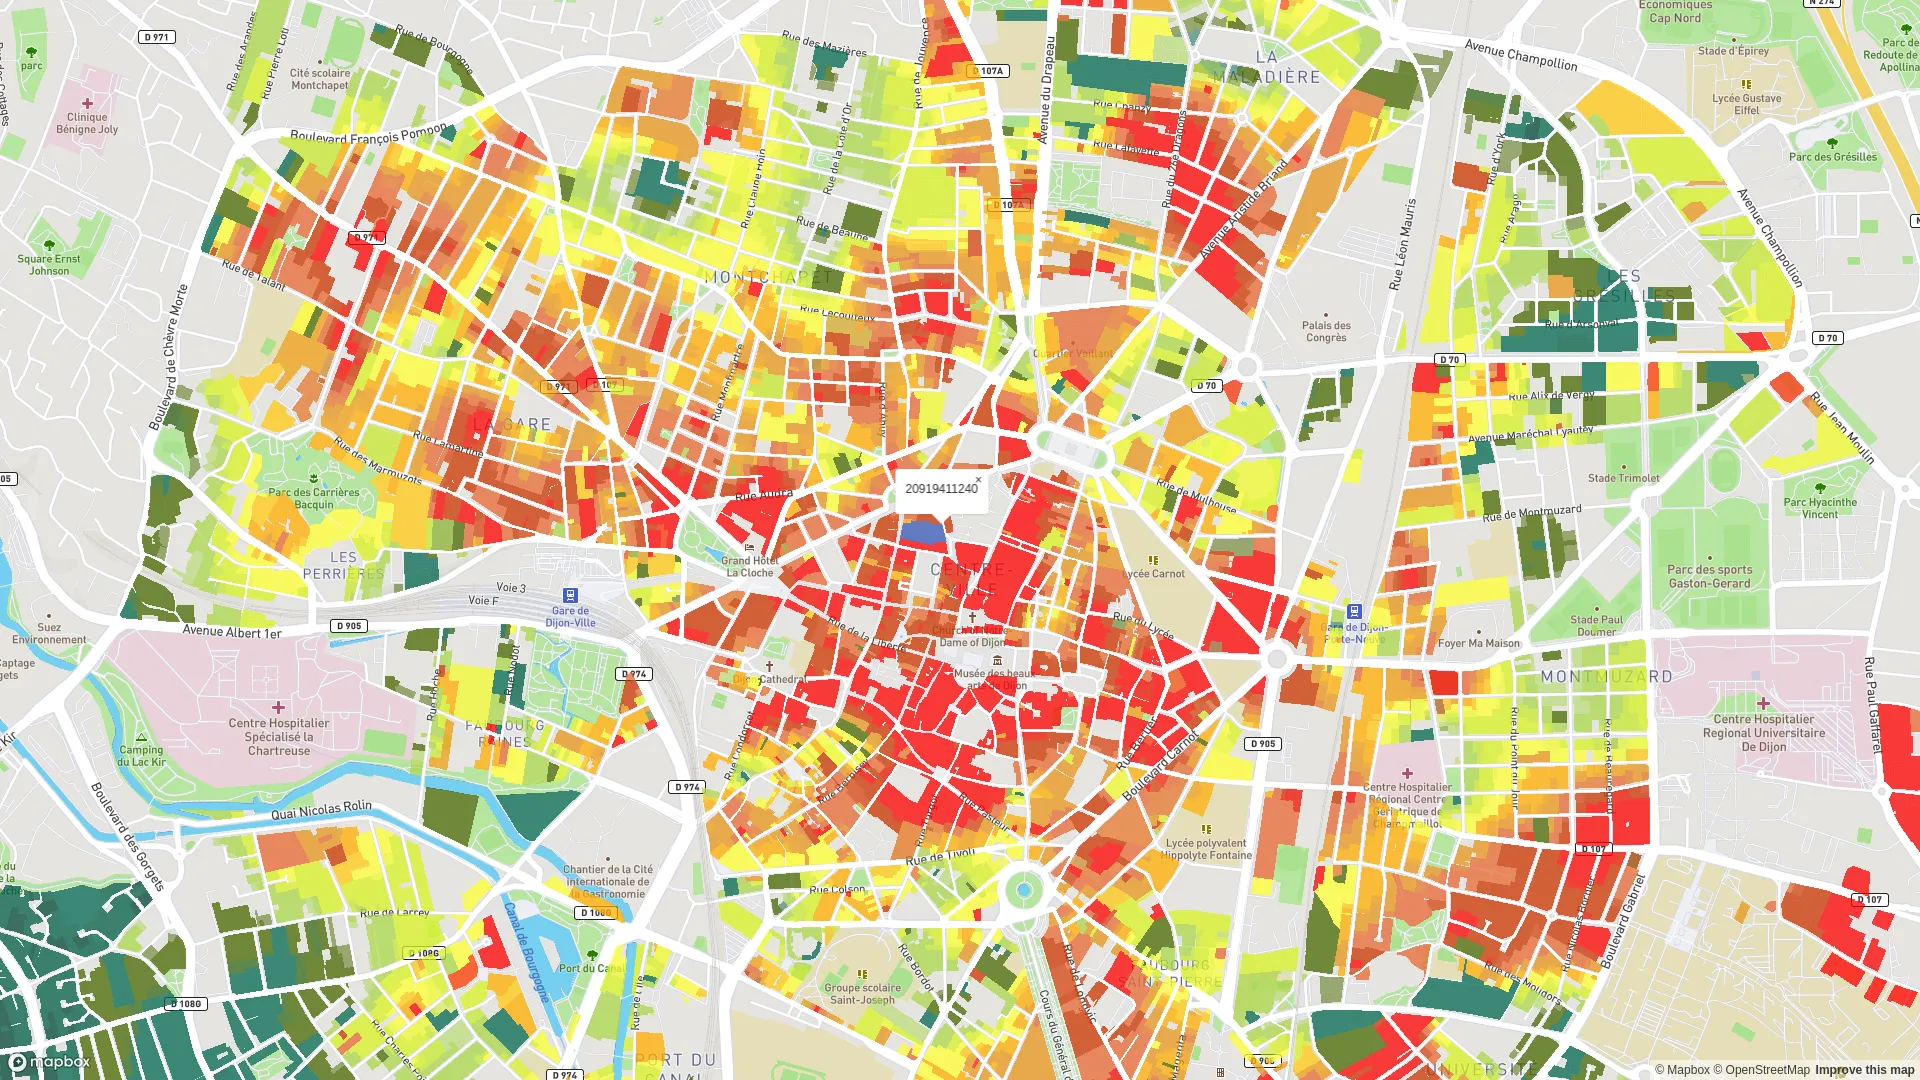
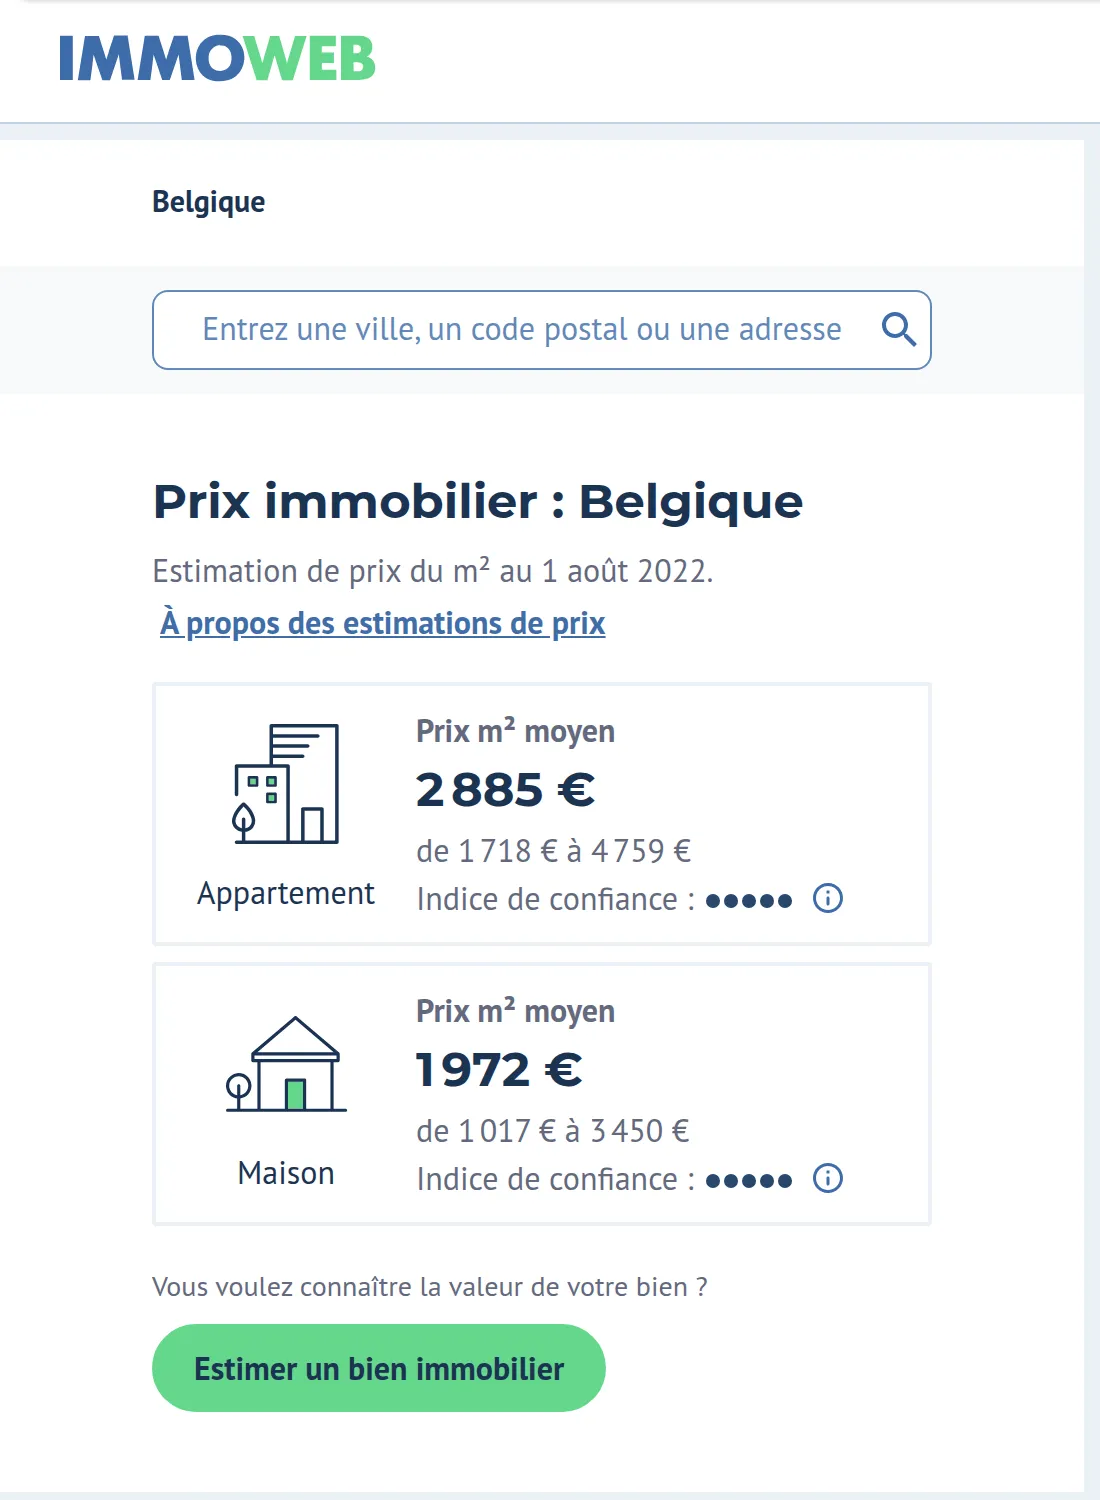
4 years on Meilleurs Agents’ data team (about 30 people). As a work-study student, I built MilleFeuillesUI, the geographic price exploration interface data scientists use to check prices and assess the estimation models. Then, as a data engineer, I helped produce the price indices, geographic prices and estimation models, and the monthly price update behind Meilleurs Agents’ price map in France and, within the AVIV group, Immoweb’s Price Map in Belgium.
Outcome: about 8 million transactions geolocated and price maps for France and Belgium refreshed every month.
What I did
Delivered features
Price computation pipelines
PySpark jobs that produce the geographic prices (MilleFeuilles) and the price-change indices every month.
Orchestrated monthly run
Monthly run orchestrated with Airflow and shipped to production on Kubernetes, with infrastructure declared in Terraform.
Price quality control
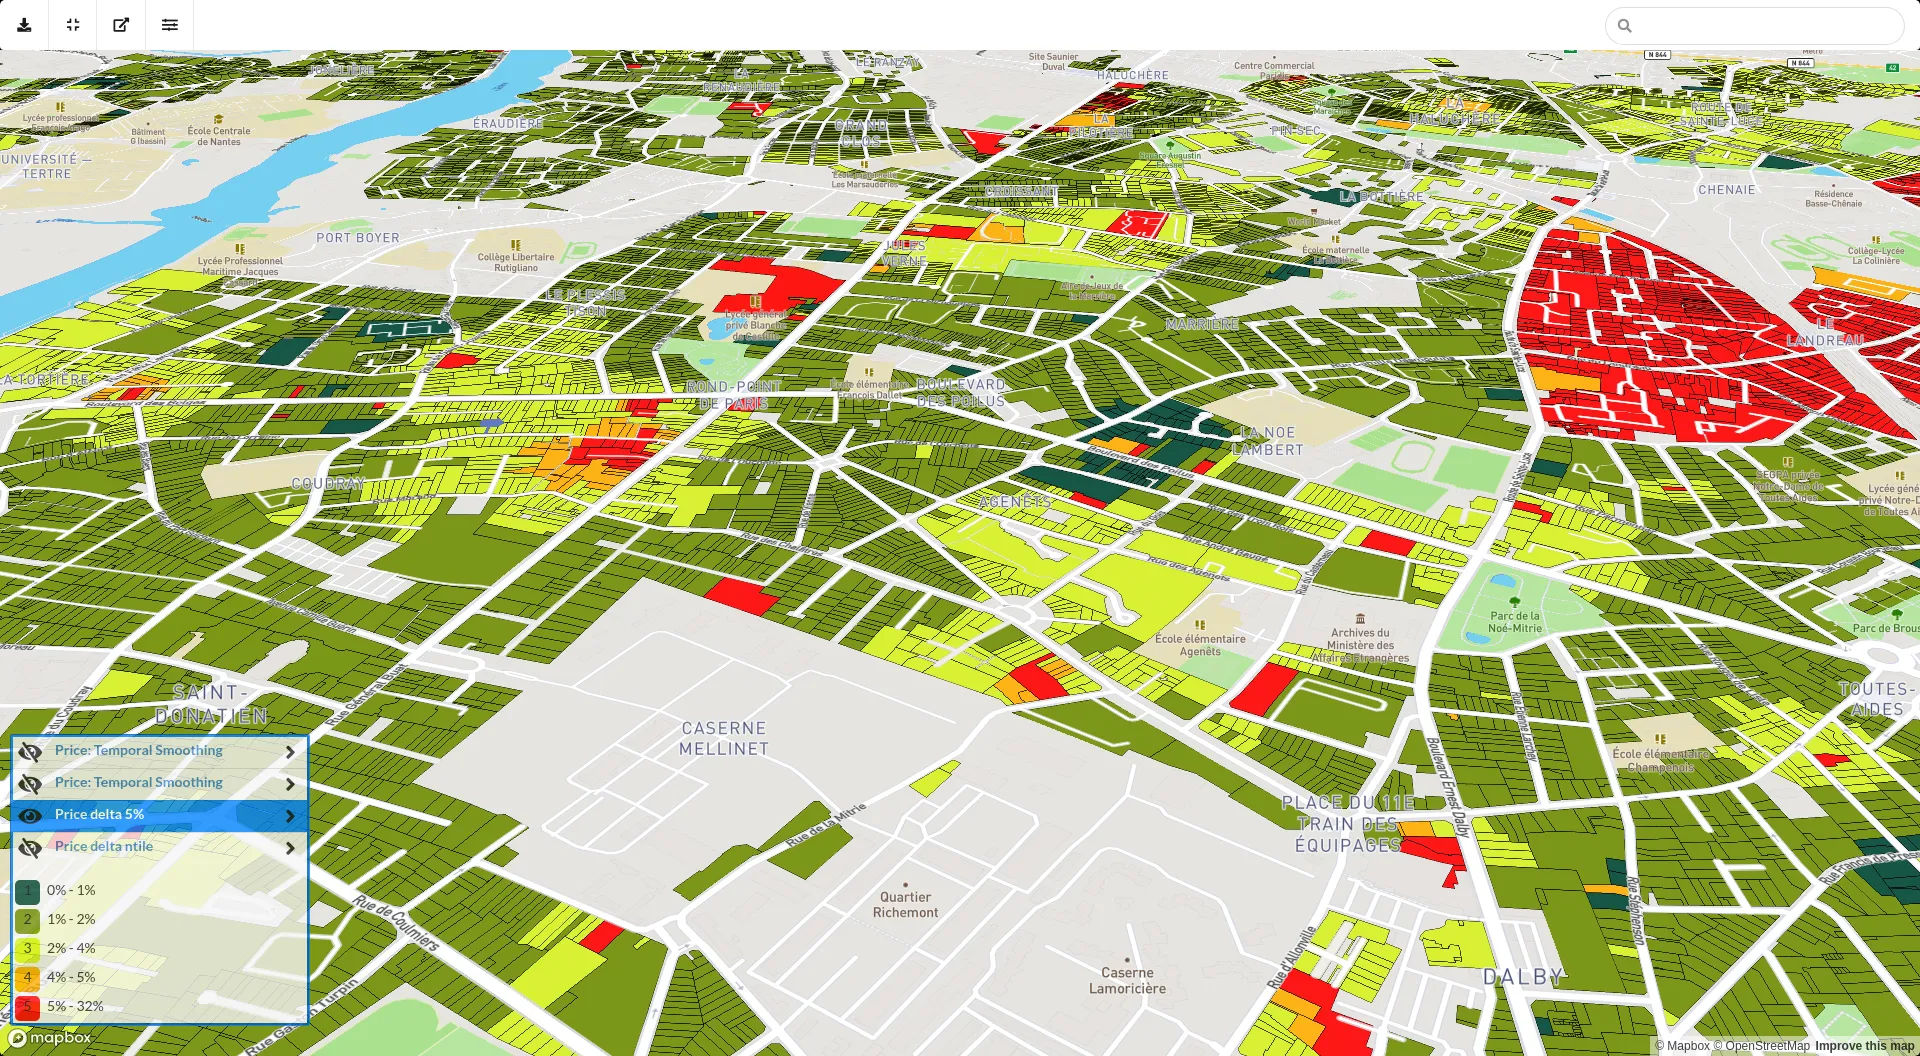
Prices checked before publication: month-over-month deltas, temporal smoothing and comparison of computation steps.
MilleFeuillesUI, the price map
React / Redux interface for exploring geographic prices down to the parcel, used by the data scientists.
Map comparison
Prices compared by month, by computation step and by property type to spot anomalies at a glance.
Dynamic colours and sharing
Adjustable colour steps and palette, choice of price source (geographic or observations) and map sharing by link.
Vector tile generation
Price extraction and PostGIS / Mapbox vector tile generation to render millions of parcels smoothly.
Transaction geocoding
Geolocation engine for about 8 million historical transactions: Levenshtein matching, Mapbox geocoding and PostGIS validation.